One of the most common questions we get about our CDN is performance: How much faster will my site be? Is it worth enabling a CDN? Does it really matter for users and Google?
In this post, we compare a simple WordPress site (snowdyssey.com) before and after enabling the CDN using three tools and three key metrics:
| Metric | Description |
|---|---|
| Network Total Time | How long it takes for the content to download. |
| Browser FCP | First Contentful Paint. |
| Browser LCP | Largest Contentful Paint. |
These metrics are important for SEO (Core Web Vitals) and—more importantly—for user experience. If users wait seconds to see content, they bounce.
GTmetrix
GTmetrix measures performance and provides optimization hints. Before vs. after:
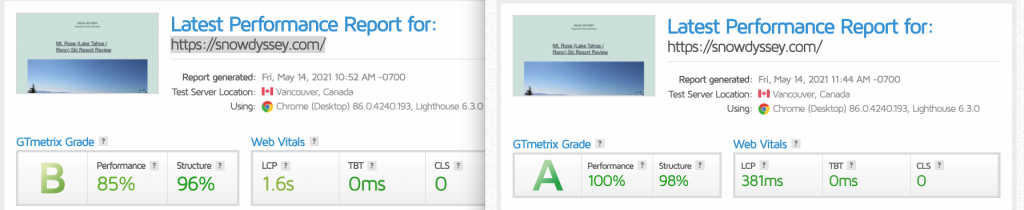
The site went from a B (85%) to an A (100%). Most notably, LCP improved from 1.6s to ~0.38s—over 4× faster—so users see the hero content in under half a second.
WebPageTest
We tested from three regions—Virginia (US), London (UK), and Singapore—to gauge global performance.
Virginia, USA
| Before CDN | After CDN | Improvement | |
|---|---|---|---|
| First Contentful Paint | 0.899 s | 0.489 s | ~2× faster |
| Largest Contentful Paint | 1.391 s | 0.864 s | ~1.8× faster |
London, UK
| Before CDN | After CDN | Improvement | |
|---|---|---|---|
| First Contentful Paint | 1.585 s | 0.390 s | ~5× faster |
| Largest Contentful Paint | 2.585 s | 0.751 s | ~3× faster |
Singapore
| Before CDN | After CDN | Improvement | |
|---|---|---|---|
| First Contentful Paint | 1.752 s | 0.510 s | ~3× faster |
| Largest Contentful Paint | 2.935 s | 0.849 s | ~3.5× faster |
In all regions, content loads significantly faster. Our edge configuration—high-performance disks and in-memory caching—keeps content fresh and close to users, improving both FCP and LCP.
Uptrends CDN Performance Check
Uptrends runs from multiple cities and reports page total time. It’s great for a global snapshot.
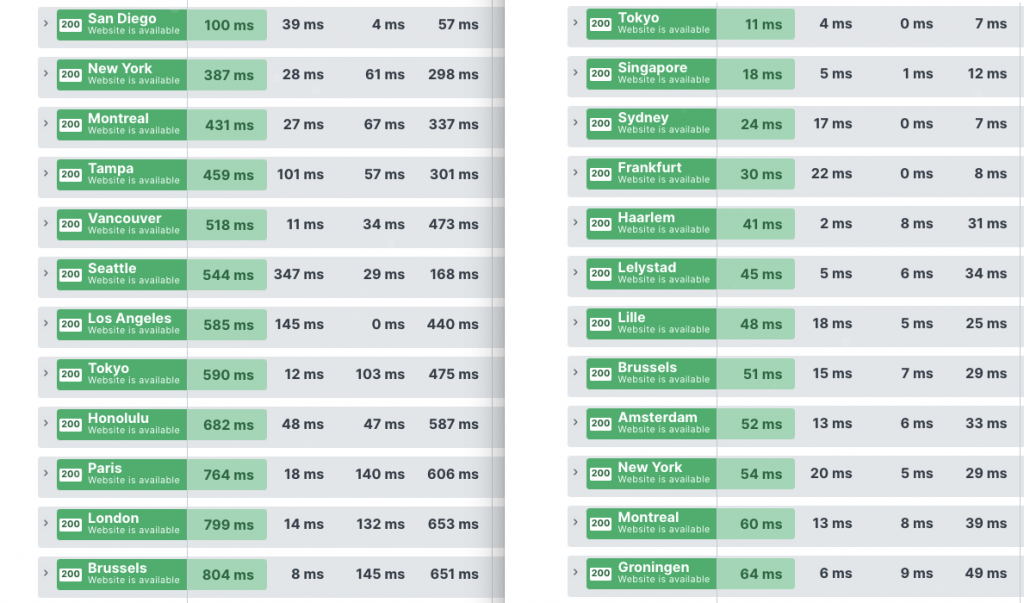
Pre-CDN, latencies climb as you move away from the origin (LA): e.g., San Diego ~100 ms, New York ~387 ms, London ~799 ms, Singapore ~963 ms. With a CDN, the picture flips—Tokyo ~11 ms, Singapore ~18 ms, Sydney ~24 ms, Frankfurt ~30 ms—double-digit times around the world.
| City | Before CDN | After CDN |
|---|---|---|
| New York | 386 ms | 60 ms |
| Toronto | 590 ms | 11 ms |
| Frankfurt | 1382 ms | 30 ms |
Performance matters
Yes, Google cares (Core Web Vitals), but more importantly, users do. CDNs materially improve perceived speed and real metrics (FCP/LCP/TTFB) across regions. How is your site performing today?
NOC — Authoritative DNS, CDN & WAF
Accelerate and protect your sites with global DNS, edge caching, and an always-on web application firewall.
See Plans